
From waveform to work order
DFA puts the sensing in the substation and the analysis on the device. What reaches your people is a short list of reports: what happened, on which phase, how often, and where to start looking.
One device per feeder, in the substation
- A single 19-inch, 1.5U rack-mount unit for each distribution circuit.
- Connects to the existing CTs and PTs, wired like a relay. Many utilities daisy-chain it into circuits already in place.
- No line sensors, and no communications with reclosers or other line devices.
- Records current and voltage at 256 samples per cycle with enough resolution to see a few amperes of arcing on a feeder carrying hundreds.
- Communications start at the device and are encrypted, so only outbound ports need to open.

Classification where the data is
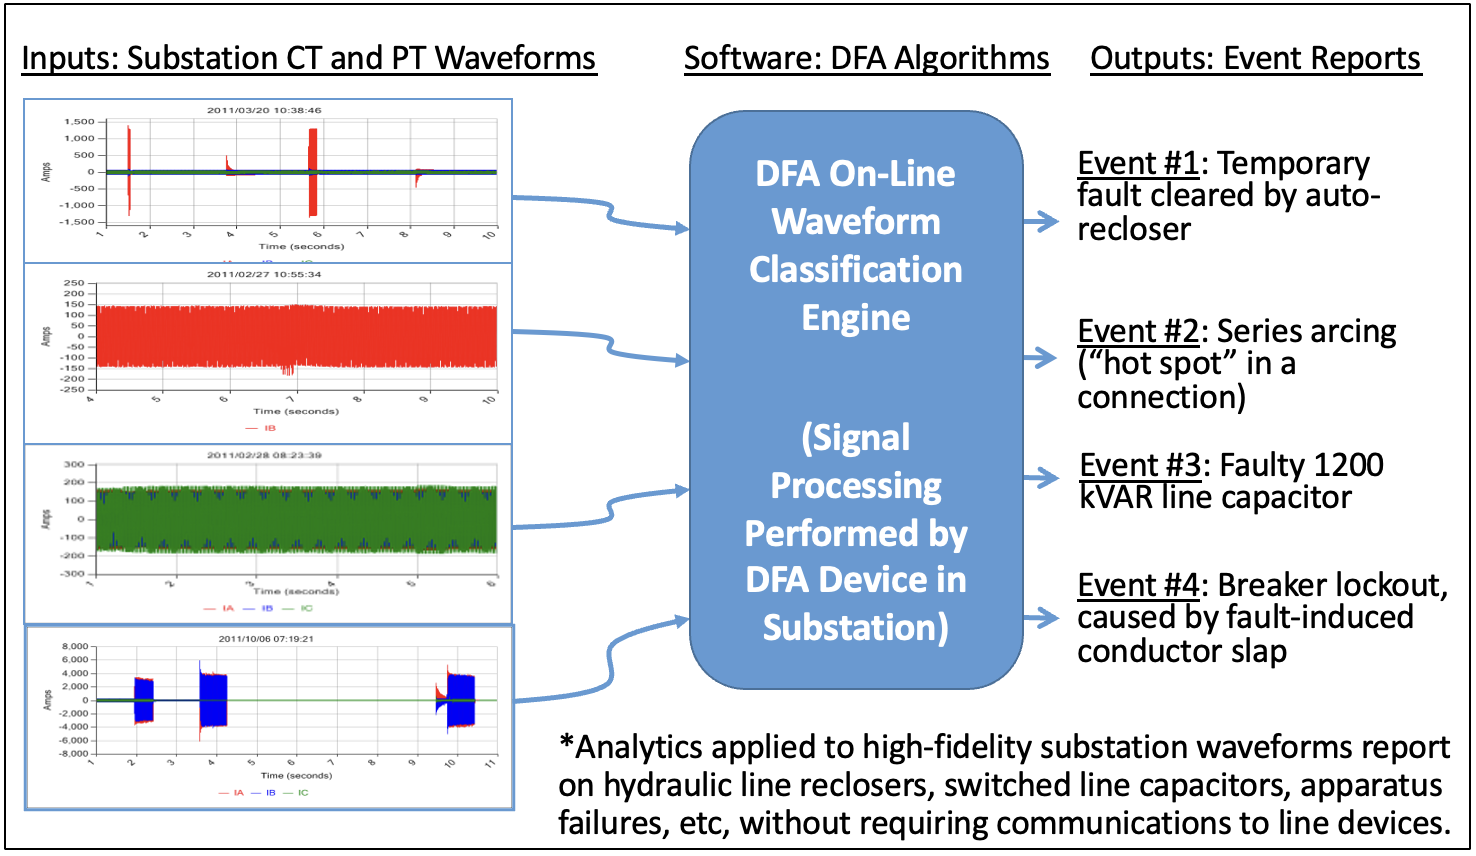
Software on each device classifies every recording against signatures documented in decades of field cases, and reports what it recognizes automatically, typically within a minute or two of the event on the line.
That keeps the noise down. In a 2023 count across 500 circuits, the system recorded about 10,000 waveforms a day and put about 50 events a day on the dashboard: a 200 to 1 reduction.
What your people see
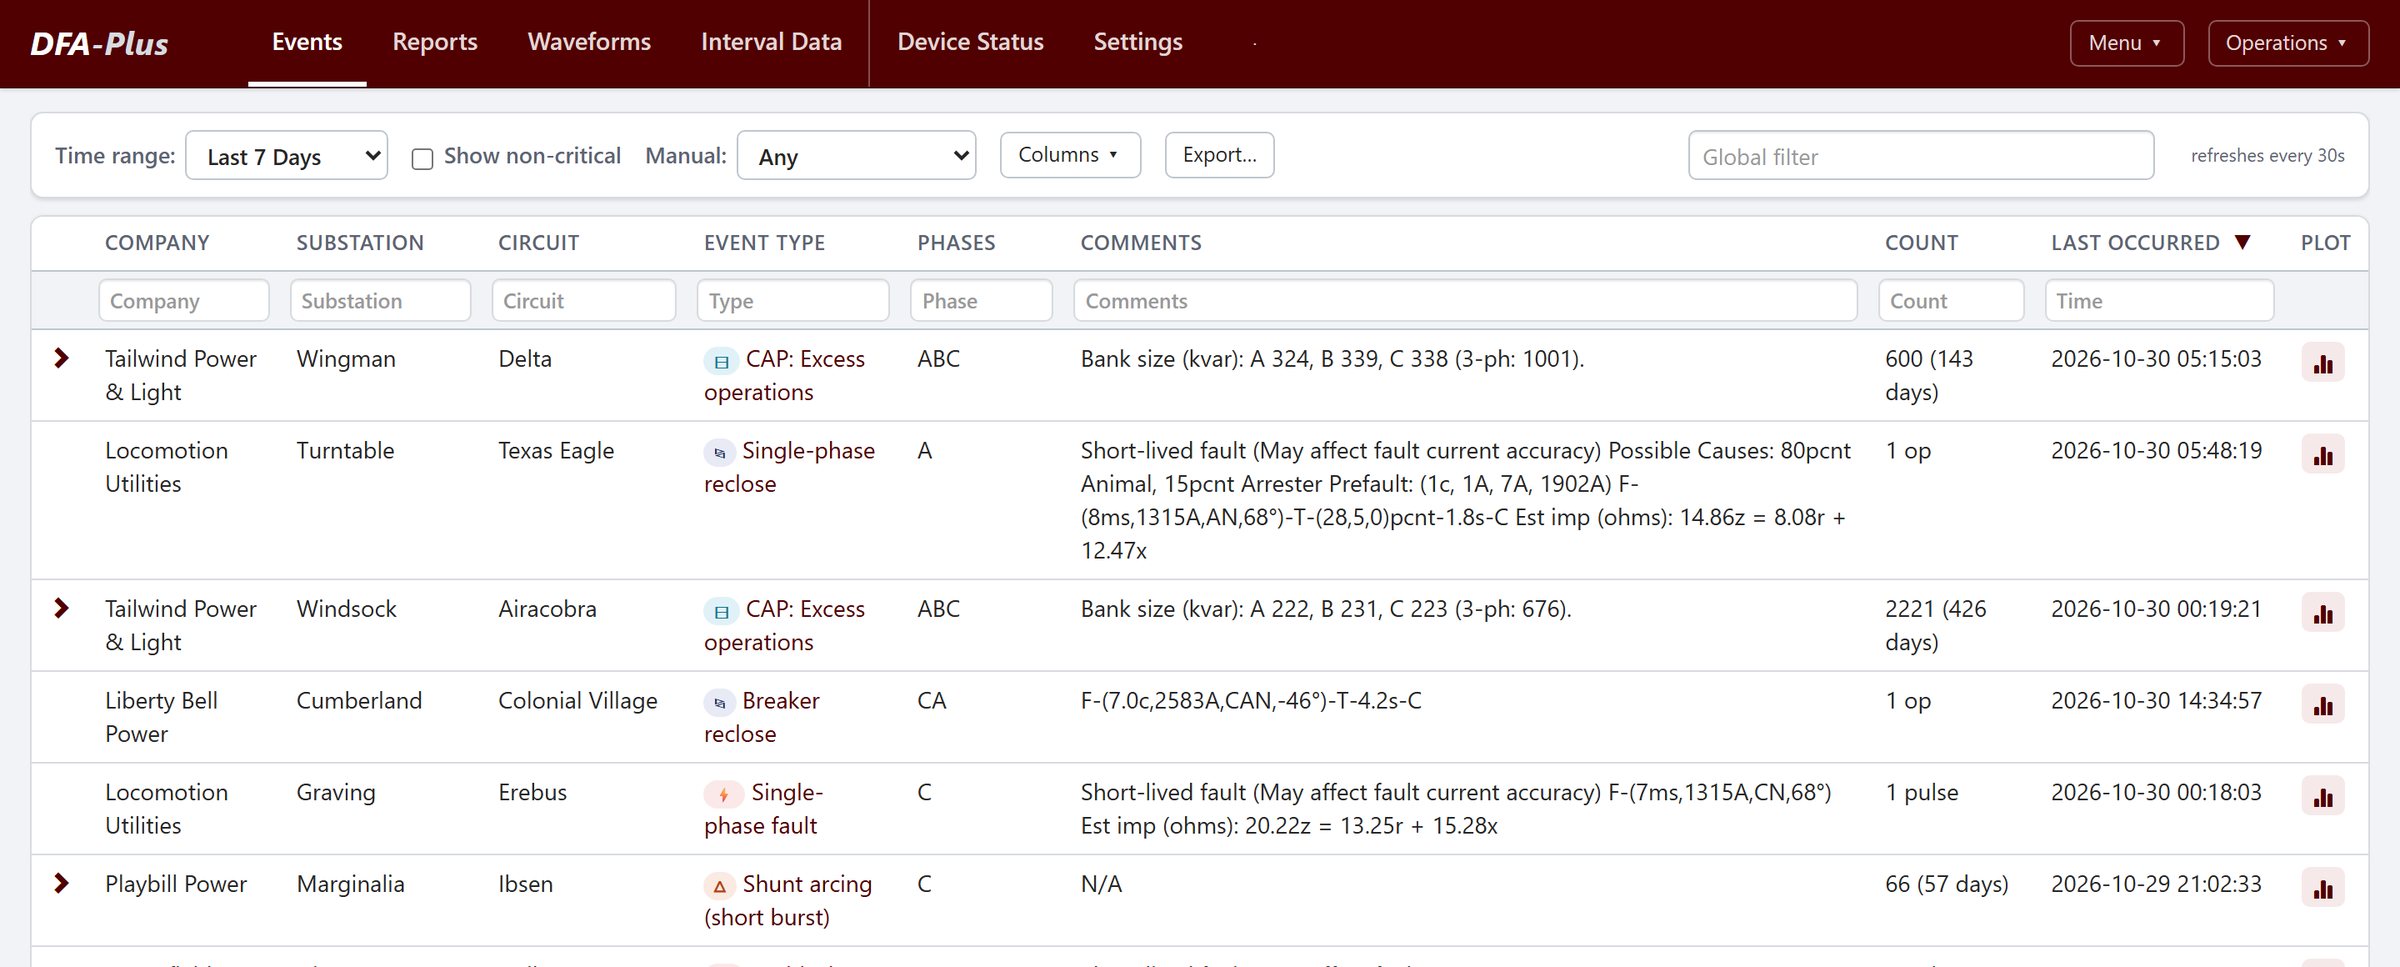
Screens from the DFA web application with live data. Utility, substation and circuit names are replaced with stand-ins.
Every event, in plain language
The event list names each event the way a crew would: a single-phase fault, a breaker reclose, shunt arcing, excess capacitor operations. Comments carry the numbers: fault current, duration, the protective response and the estimated impedance to the fault.
A failing connection, before it fails
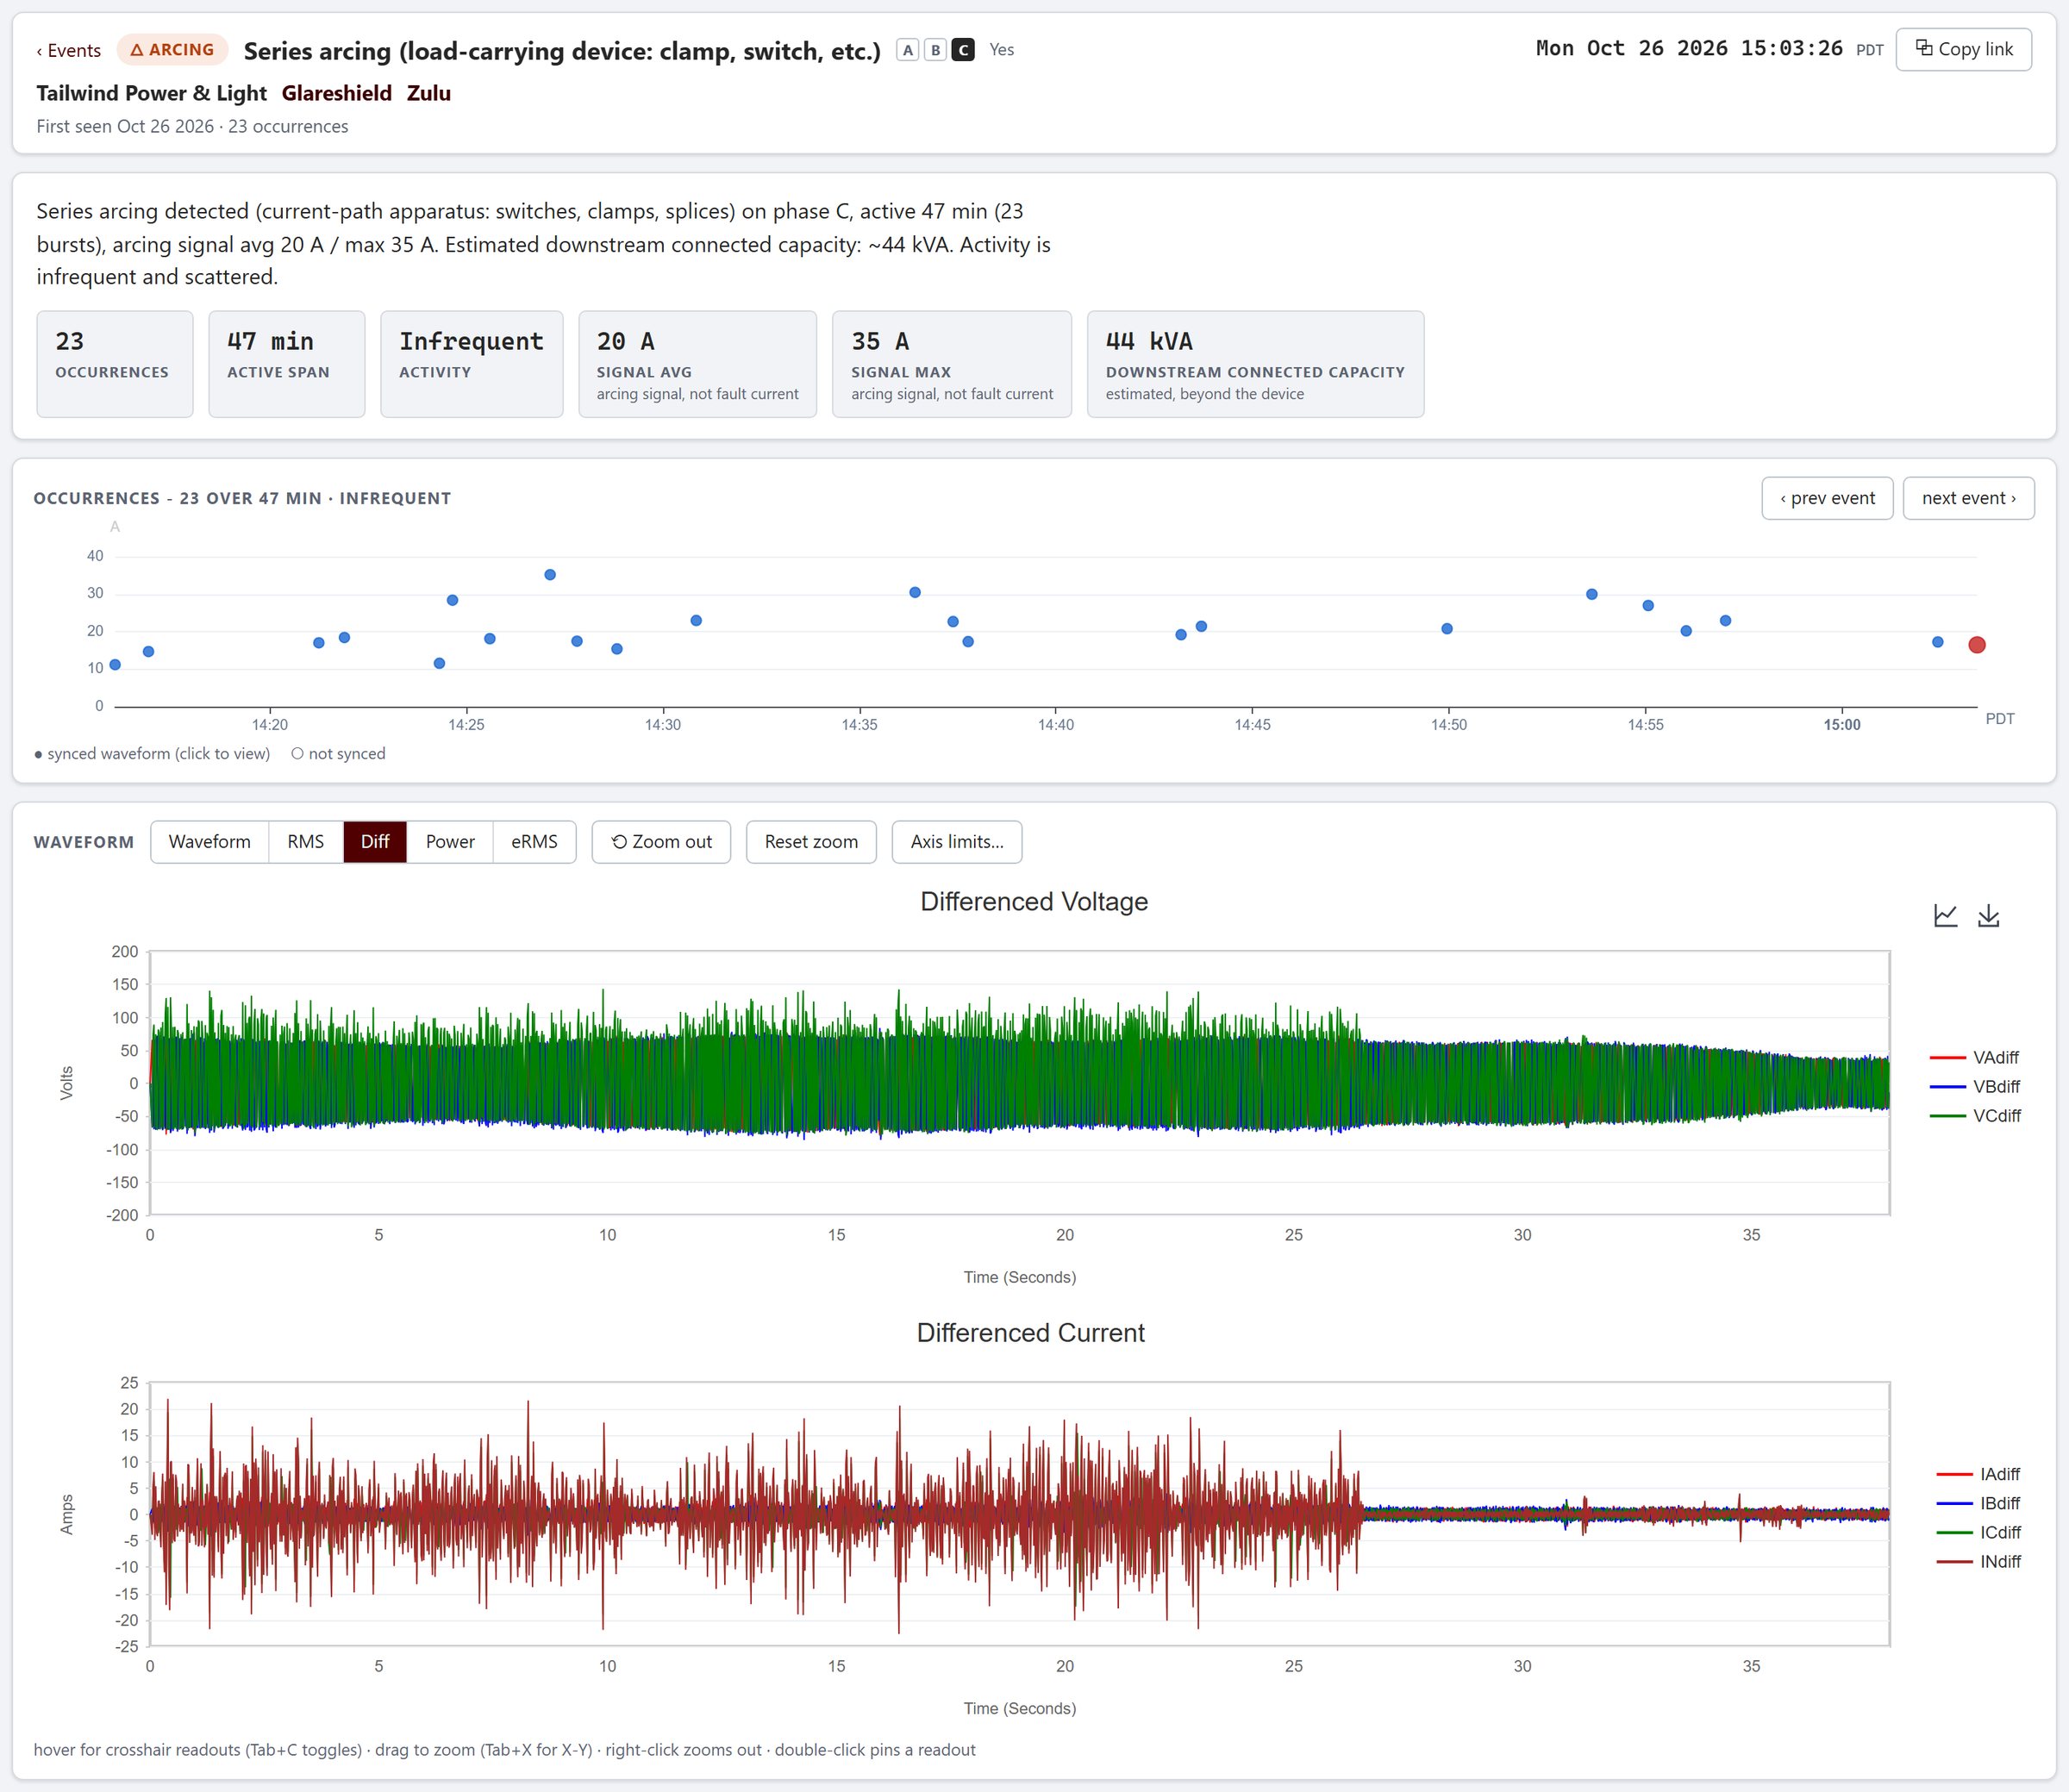
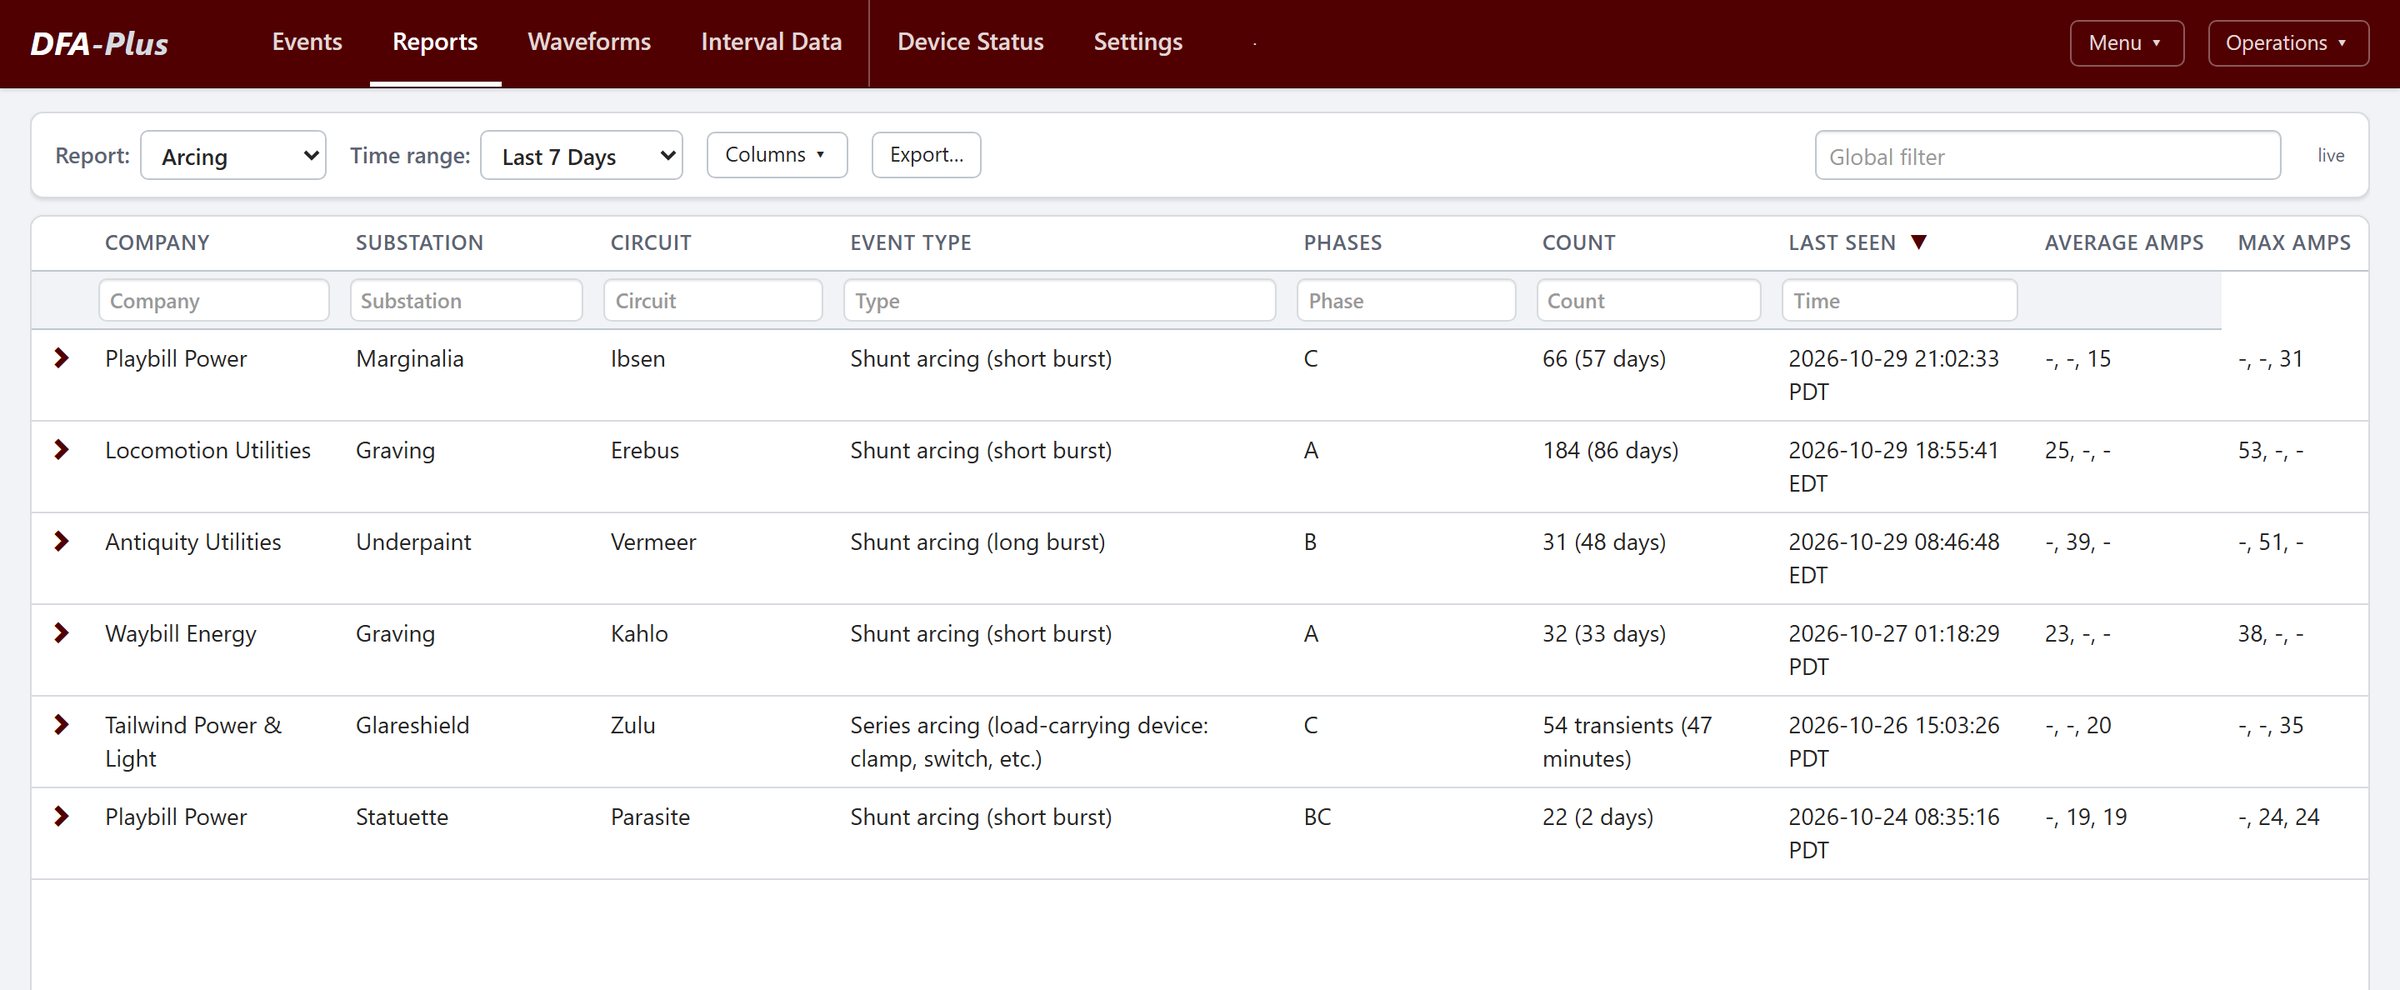
A series-arcing report says which phase, how long the arcing has gone on, how many bursts, and how much connected load sits beyond the failing device. That last figure tells the crew which part of the circuit to search.
The second blink is a work order
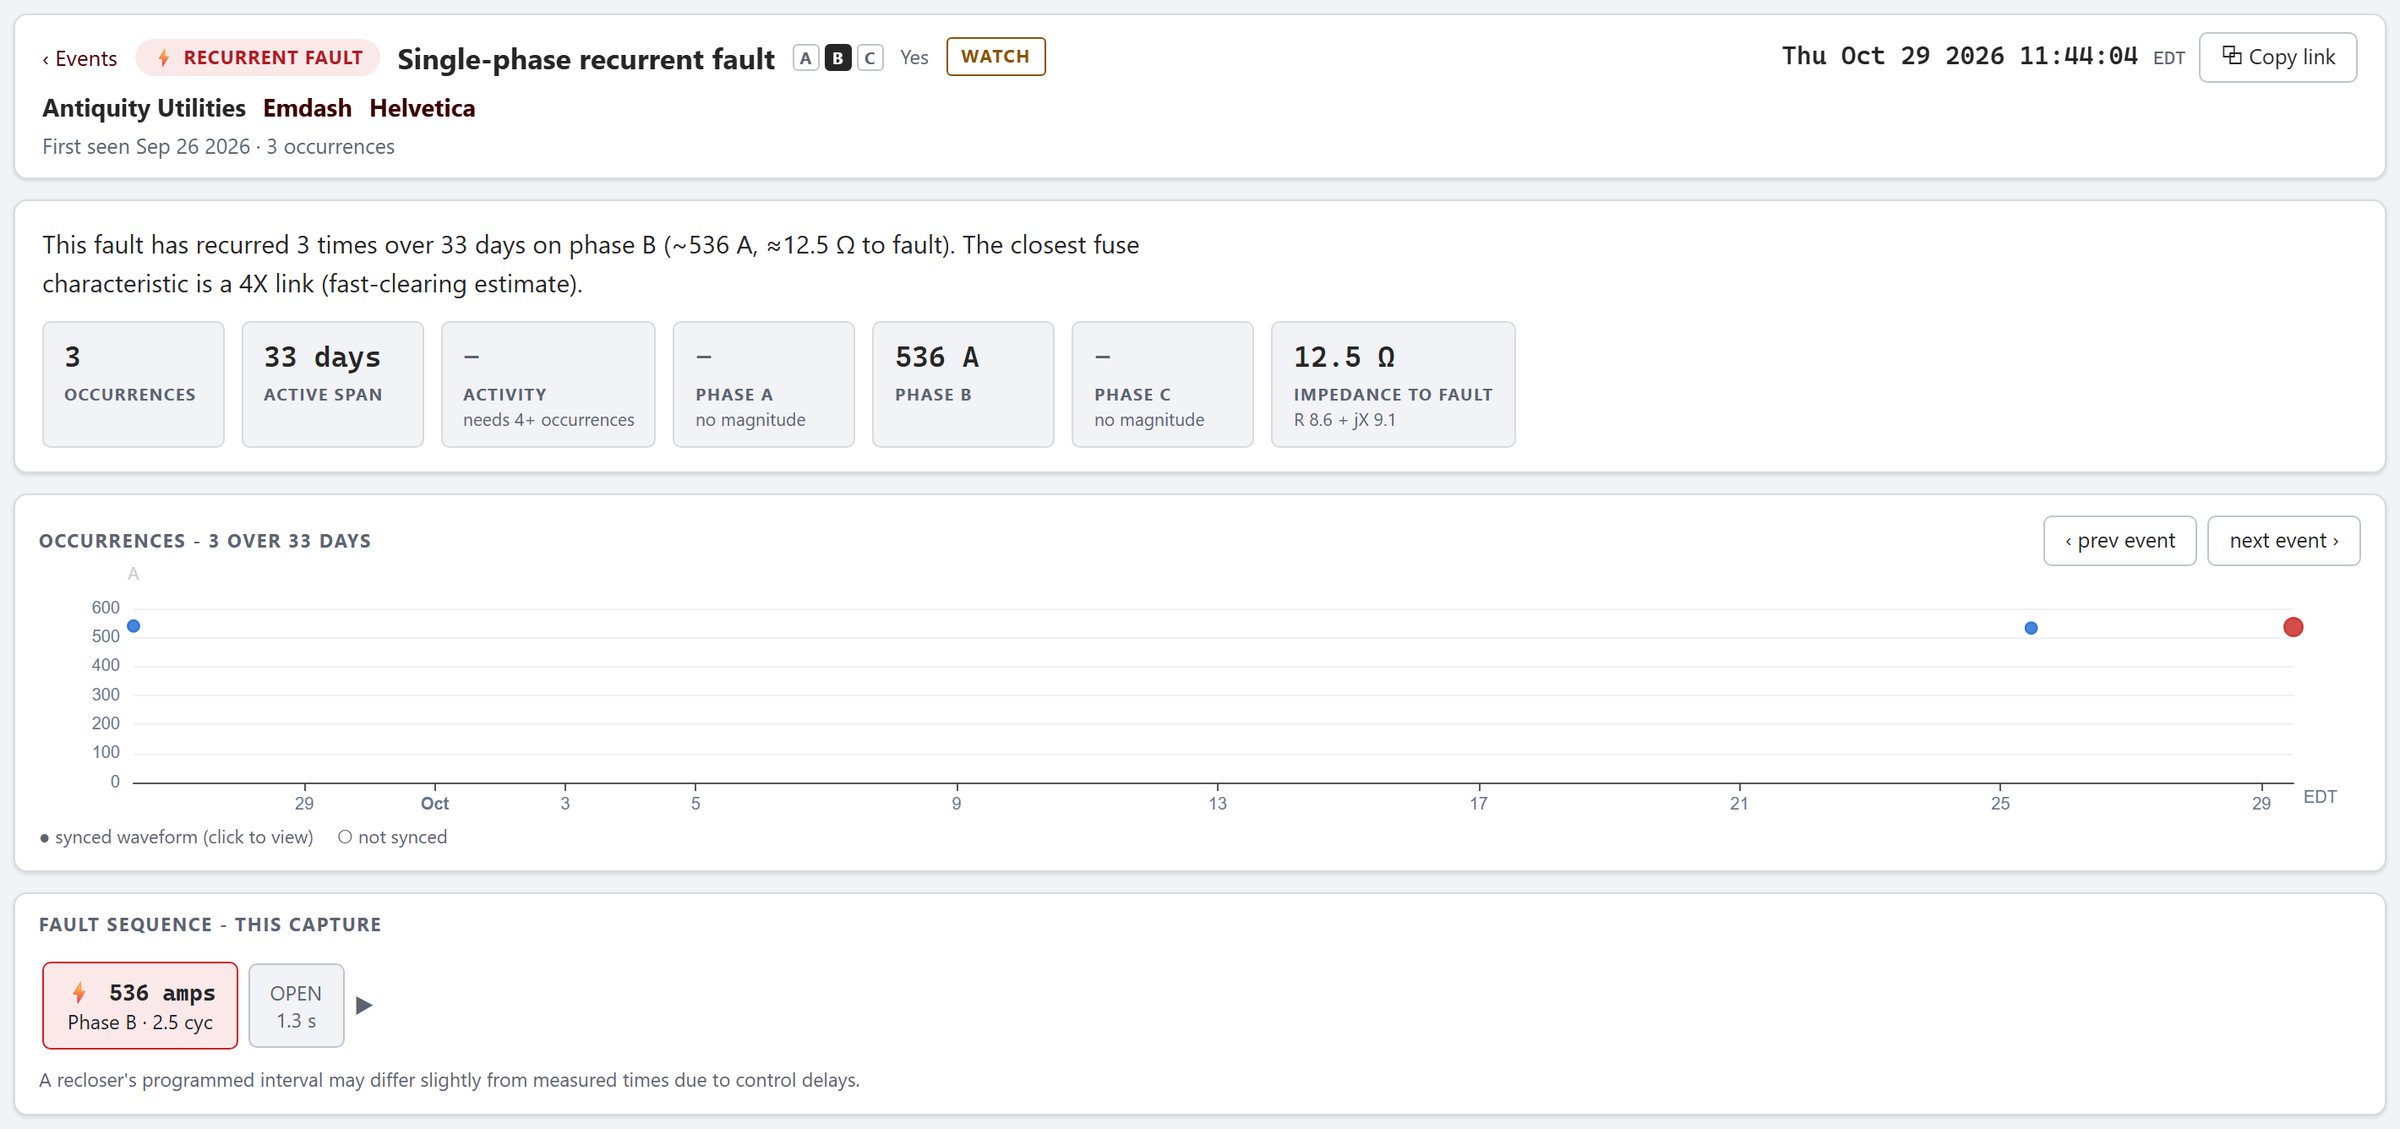
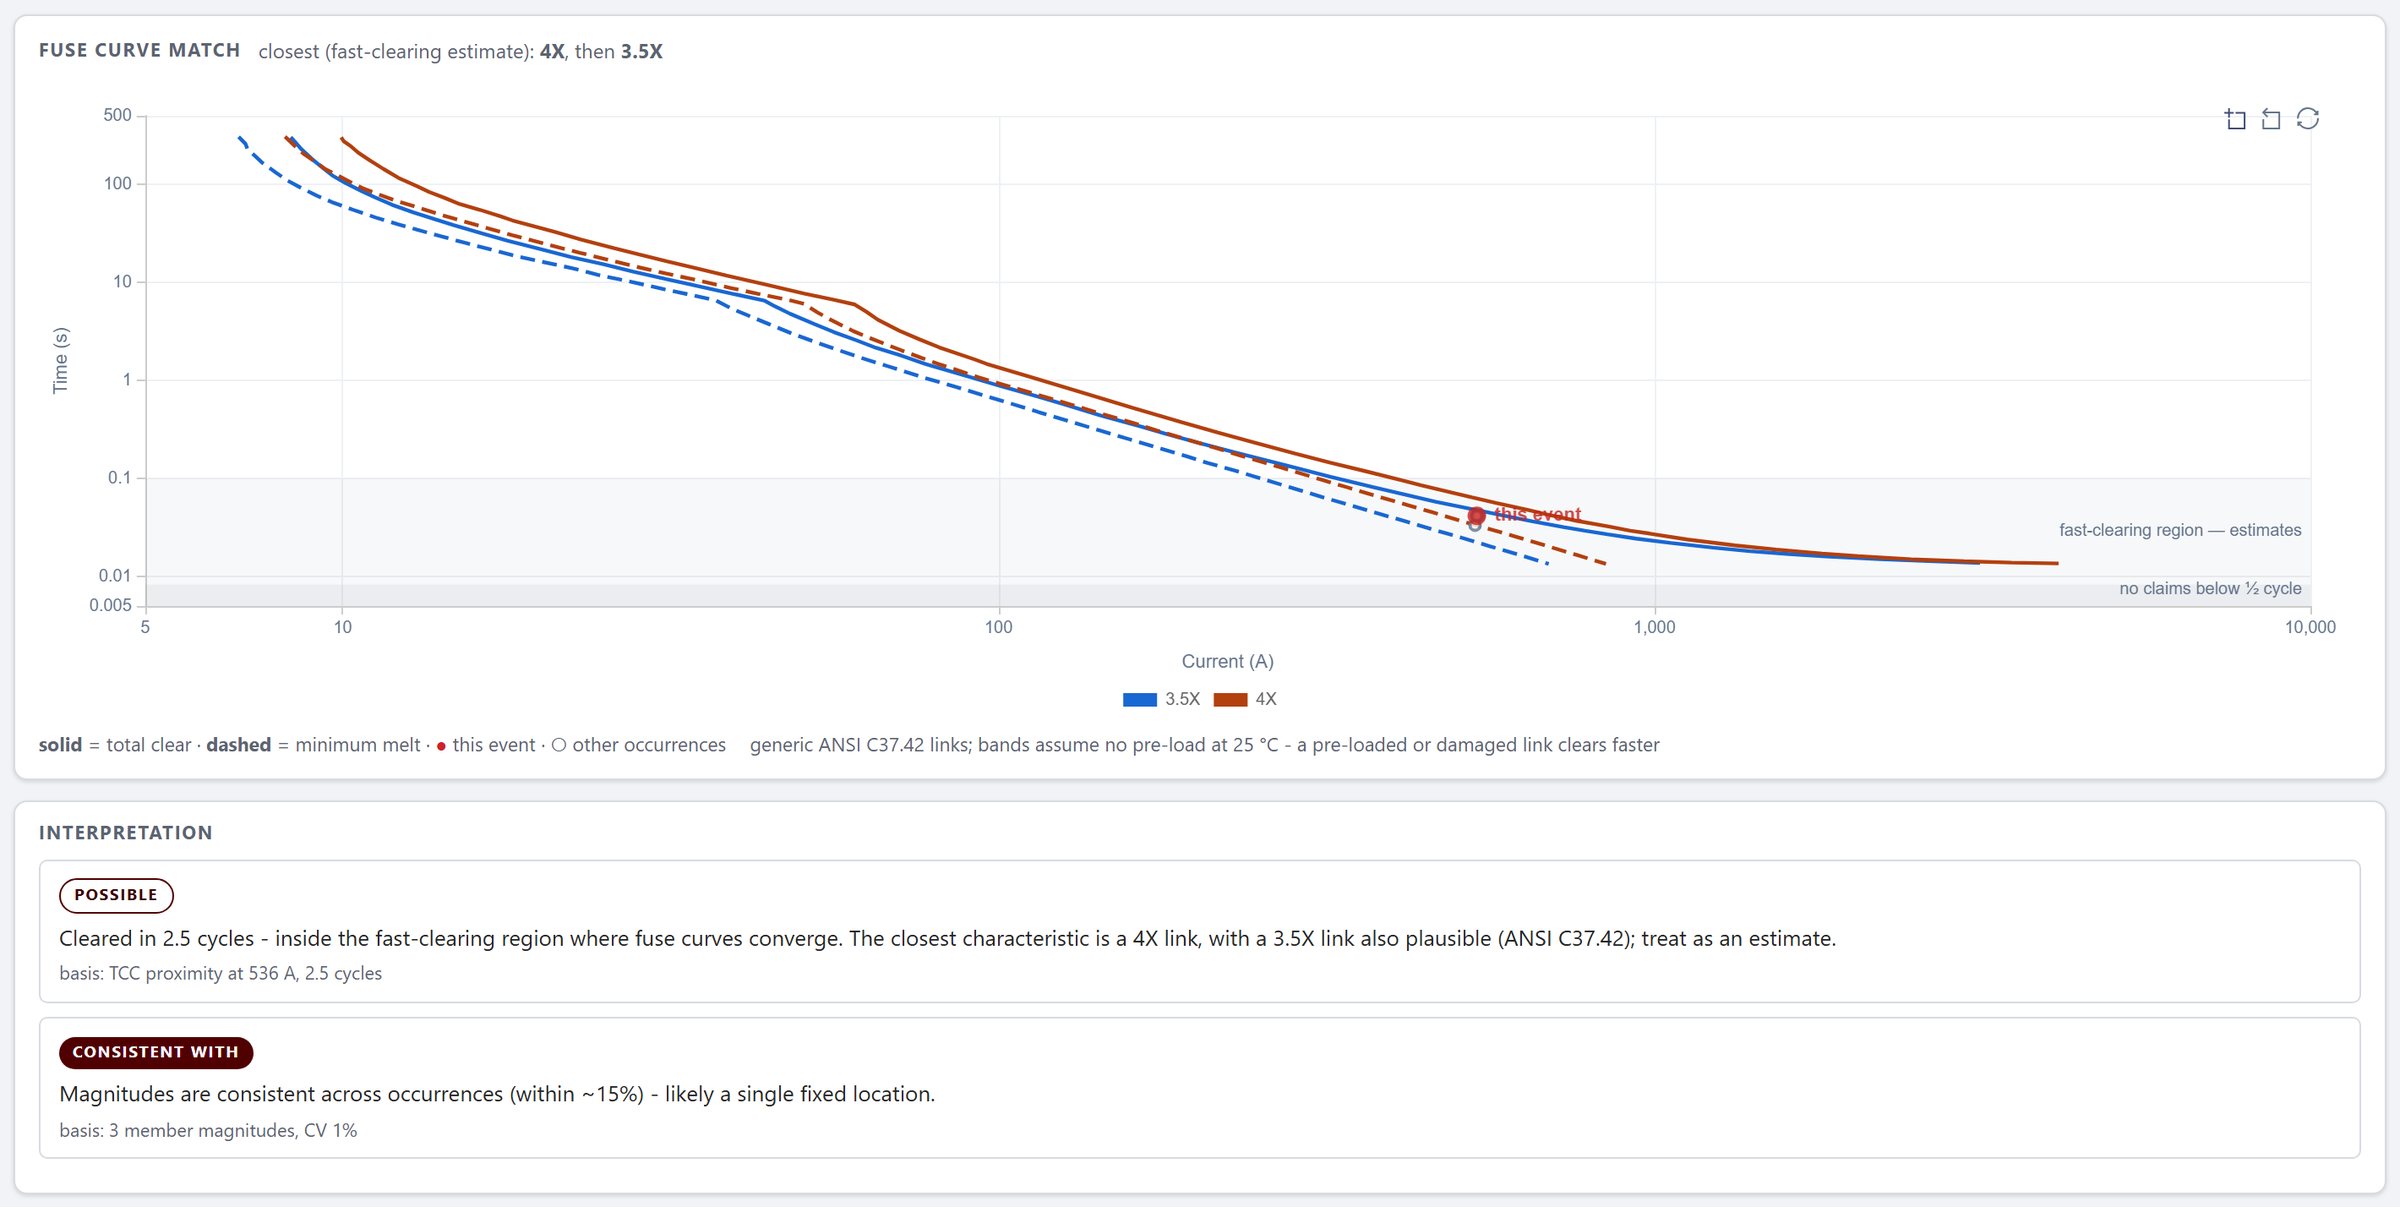
When a fault repeats, DFA groups the occurrences and says so: three times in 33 days, phase B, about 536 A, 12.5 ohms to the fault. Matching magnitudes point to one fixed location.
Which device operated
For fuse-cleared faults, DFA compares the clearing time and current with fuse curves and names the closest link size. Enter that with the fault current into the circuit model and the candidate list gets short.
The history of the circuit
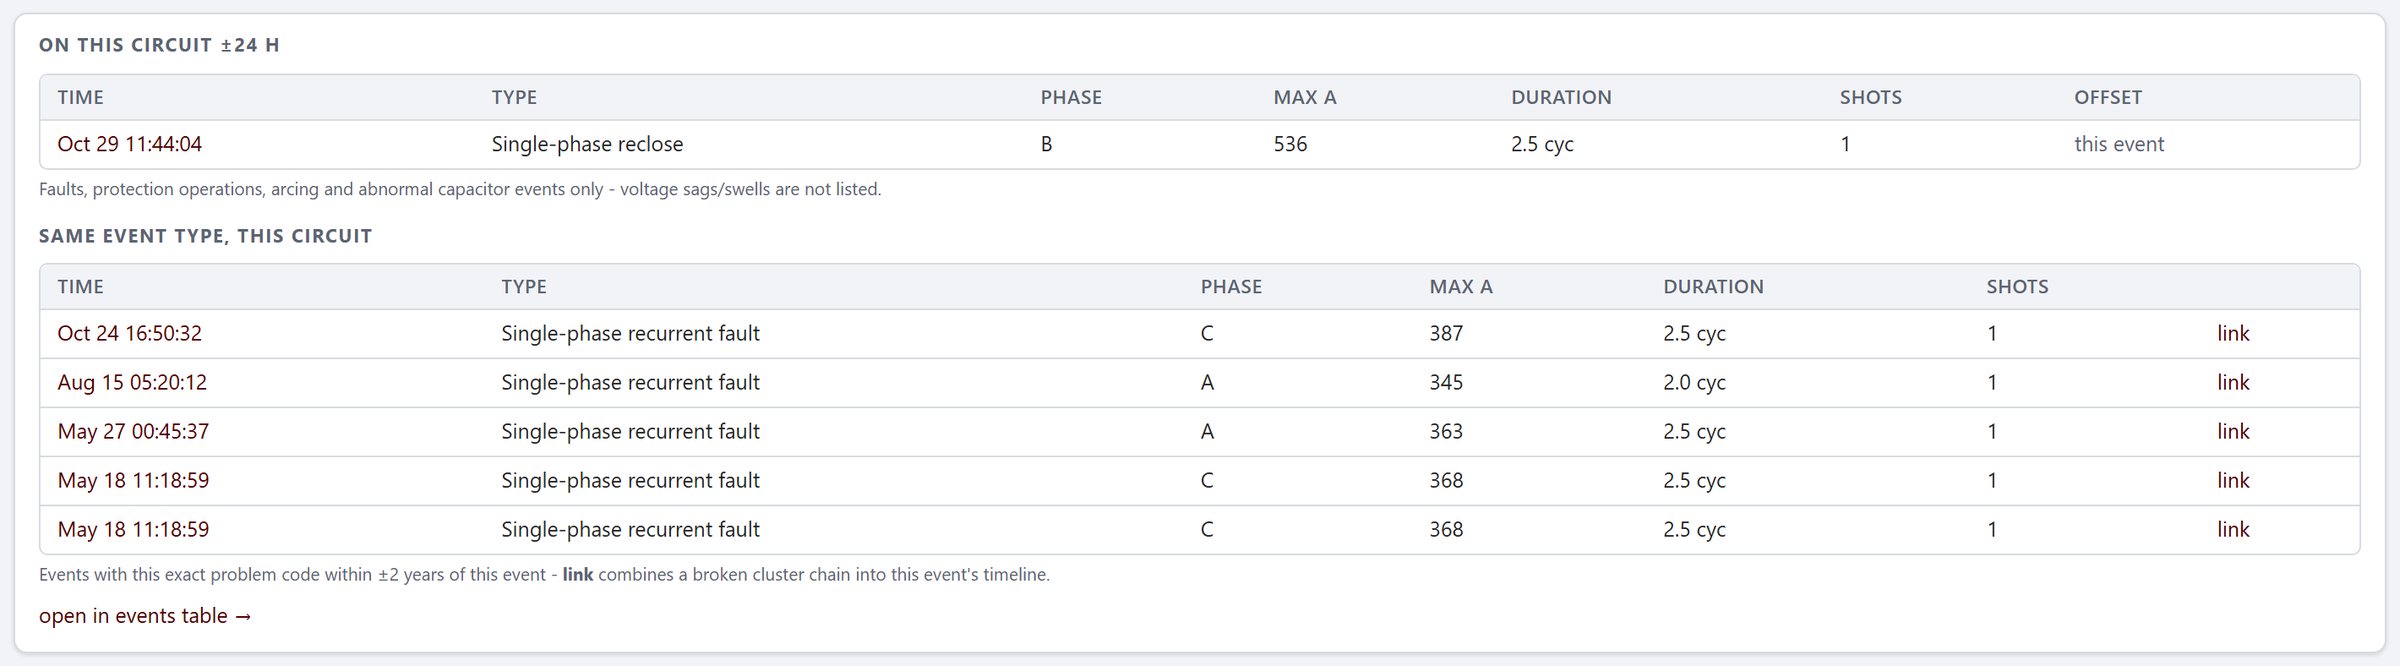
Every event page lists what else happened on that circuit within a day, and every earlier event of the same type, so a pattern months long shows up on one screen.
Standing reports
Reports roll up what needs attention across the system, such as every circuit with active arcing, how long it has gone on and how strong it is.
In the truck
The same reports open on a phone, laid out for one hand.


Told within minutes
Users choose which events reach them by email or text: faults, breaker trips and recloses, series arcing, other arcing and capacitor arcing. Under normal conditions the system notifies a user of an incipient failure within minutes of its occurrence on the line.
How crews find it
- Faults: enter DFA's fault current into the circuit model, ping meters in the predicted area, dispatch.
- Recurring faults with no outage: match the phase, open interval and load lost to identify the recloser doing the work, then search only beyond it.
- Series arcing: use the load beyond the failing device, not distance, and ping meters during a flare-up to bracket it.
- Capacitors: match the switching time to the capacitor controller's log and write the work order.
Start with a pilot that can succeed
Size it to see events
A pilot needs enough circuits to encounter a meaningful number of events in a reasonable time, and people engaged enough to get a feel for the day-to-day benefit.
Hosted or on site
Devices report to a DFA master station. One instance on modest server hardware supports more than 1,000 devices.
Priced like a meter
A DFA device costs on the order of a high-end power quality monitor. Some utilities say moving capacitors to condition-based maintenance alone pays for it.